We approach marketing holistically, so sometimes that means we are faced with more technical aspects of marketing. Google’s Core Web Vitals are one of those more technical pieces that are not as intuitive as we’d hope, so let’s break it down!
In order to access these metrics you will need Google Analytics installed and collecting data for at least 28 days. These metrics track anonymous Google Chrome user data in order to calculate your results. So if you don’t have Google Analytics installed, start there. If you do, then you’re ready to start looking at your report!
You’ll find your reports through Google’s Search Console.
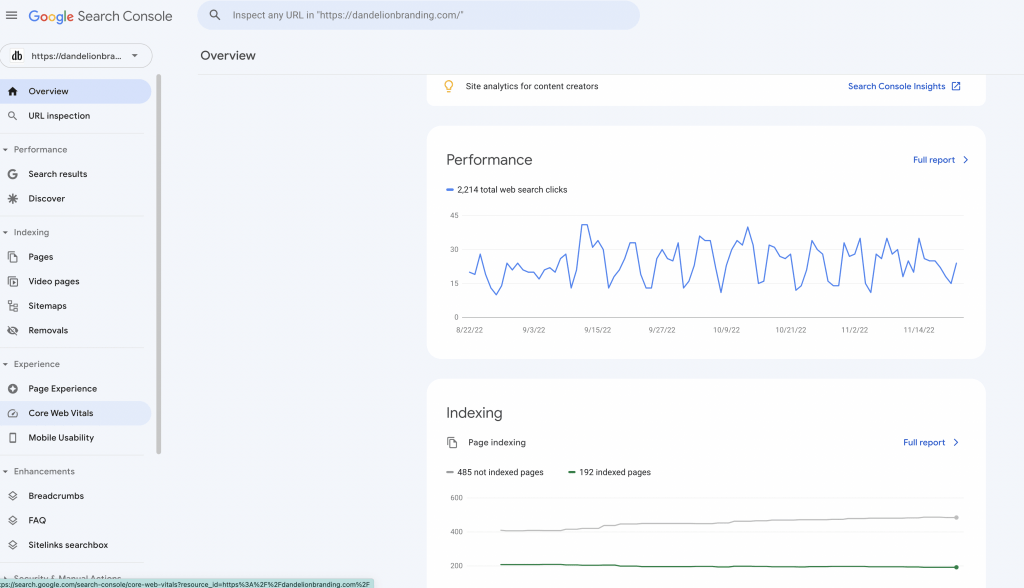
Once you access your report by clicking Core Web Vitals on the left hand side, and then clicking Open Report. There you’ll likely see some graphs that show red, yellow, and green lines. These indicate the URLs that have good, bad, and moderate scores. Once you look into the specific URLs and their potential error messages you’ll start to see the use of the core web vital acronyms: LCP, CSL, and FID.
Here I’ll be defining each of these metrics, but stay tuned for future videos in this series where I’ll go over why each is so important for your site, and will give tips for how to improve your results for each metric.
What are Core Web Vitals?
These metrics are Google’s way of categorizing website performance issues that affect user experience.
These are really a health check for your website. Google provides a report of all pages and how they perform on both mobile and desktop.
Largest Contentful Paint
You’ll see this listed as LCP. This metric measures loading performance. This means the time it takes for the largest visual element to load into view. This is likely an image and title heading. Ideal LCP is less than 2.5 seconds
First Input Delay
You’ll see this noted as FID. FID measures how quickly your website takes to become interactive. This is the time in takes for your site to respond to inputs from the user. Ideal FID is 100 milliseconds or less.
Cumulative Layout Shift
This is listed as CLS. This metric measures the visual stability of your site as it loads. This is documenting and measuring how much different visual elements of your site shift and move as things load. Ideal CLS is 0.1 seconds or less.
If you’re focusing on website performance and need any help please get in touch! ❤️ Here’s a link to our calendar, let’s find a time to chat!
Interested in Learning More About Core Web Vitals?
Check out our other videos on this topic!